


Most brand tracking budgets are renewed every year without anyone testing what they return. The tracker becomes a fixed cost, the waves arrive on schedule, and the question of value never reaches the agenda. Our new Brand Tracking ROI Calculator puts it there, using your own numbers.
Why brand health tracking costs more every year

Survey-based brand health tracking has a structural problem: fewer people answer surveys. Pew Research Center’s typical telephone response rate fell from 36% in 1997 to 6% in 2018. Every point of that decline means more spend to reach the same sample.
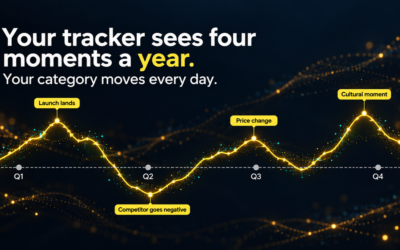
The result is a familiar trade-off. Budgets cap how often you can field a study and how many brands you can include. So most teams settle for a quarterly or annual snapshot of a handful of competitors, and make decisions in the gaps between waves.
A better way of measuring brand equity

Brand Pulse takes a different approach to measuring brand equity. Instead of asking consumers what they think, it reads what they already say and do: the conversations, searches and reviews happening on TikTok, YouTube and beyond. That includes the audiences who never answer surveys.
Because the data already exists, measurement can be continuous rather than periodic. You can track every brand in your category, not just the few a survey budget stretches to. You can add or change attributes without limit, and your historical data stays intact.
That changes the economics. The question is no longer only “what does our tracker cost?” but “what would always-on measurement of the whole category be worth?”
How the brand tracking ROI calculator works

Most ROI figures in the insights market come from commissioned studies of a composite company. They are useful context, but they are not your business. The calculator starts with your programme instead, in four steps.
-
- Your current methodology. Enter the categories and geographies you track, your cost per study and how often you field it
- The Brand Pulse model. Choose monthly or quarterly Brand Pulse reads, decide how many surveys you would still run alongside it, and add any extra brands you would cover
- The ROI analysis. See your survey savings, your net savings after Brand Pulse spend, and the value of tracking more brands, more often
- The value of the insight. Add the return the tracking data itself generates, and get one total ROI figure
Every default can be overwritten, so the result reflects your assumptions, not ours.
Where the return comes from

Cost savings are the most visible result, and usually the first thing finance asks about. Fewer survey waves mean a smaller research bill, even once Brand Pulse spend is accounted for.
But savings are the floor, not the ceiling. The calculator also puts a value on what you gain: more frequent reads, coverage of every competitor rather than a shortlist, and insight that informs decisions all year instead of arriving in a single debrief.
That changes the budget conversation. Brand tracking stops being a fixed cost to defend and becomes an investment with a return you can show, in your categories, your markets and your numbers.
And you can see exactly where that return sits, whether in savings, coverage or speed.
Take your numbers into the budget conversation

The calculator takes about two minutes. When you are done, download a custom ROI Excel sheet to share with finance, procurement or your leadership team. If you want to go further, our team will run the ROI against your real programme in a free consultation.
Calculate your brand tracking ROI