


We picked ten US shampoo brands that grew their consumer review ratings this year, most of them without the media weight of a household name behind them. This is not a top ten. It is ten brands that met a set of criteria we set in advance, and one of them turned out to be more interesting than its score alone suggests.
From the outside, shampoo looks like a settled category. The global market is worth around USD 37 billion, growing at close to 5% a year. US hair care is worth billions and L’Oreal, Procter & Gamble, Unilever and Kenvue together hold a substantial share.
Look closer and it is anything but settled. Hair care remains fragmented, the leaders sharing digital shelf space with hundreds of smaller challengers. Nobody even publishes a definitive count of shampoo brands. That long tail is where a lot of the momentum sits, and the brands in it are earning their scores rather than buying them.
Why we stripped out the promoted reviews

A rating includes everyone who tapped a star, most of whom never wrote a word. A review comes from someone who took the time to explain why. A slightly smaller sample, and a more considered one.
Then there is promotion. Incentivised reviews, and syndicated reviews shared across multiple retailer sites, both lift the headline number without telling you much about the product. Excluding them leaves brands winning on product performance and organic advocacy alone, which is a harder test and a more useful one.
Every figure below is non-promoted only.
How we chose “the ten”

We screened US shampoo in CX Bench against three criteria: 100 to 2,000 non-promoted reviews in the twelve months to June 2026, a review rating of 4.5 or better, and rating growth on the prior year and chose ten that cleared all three.
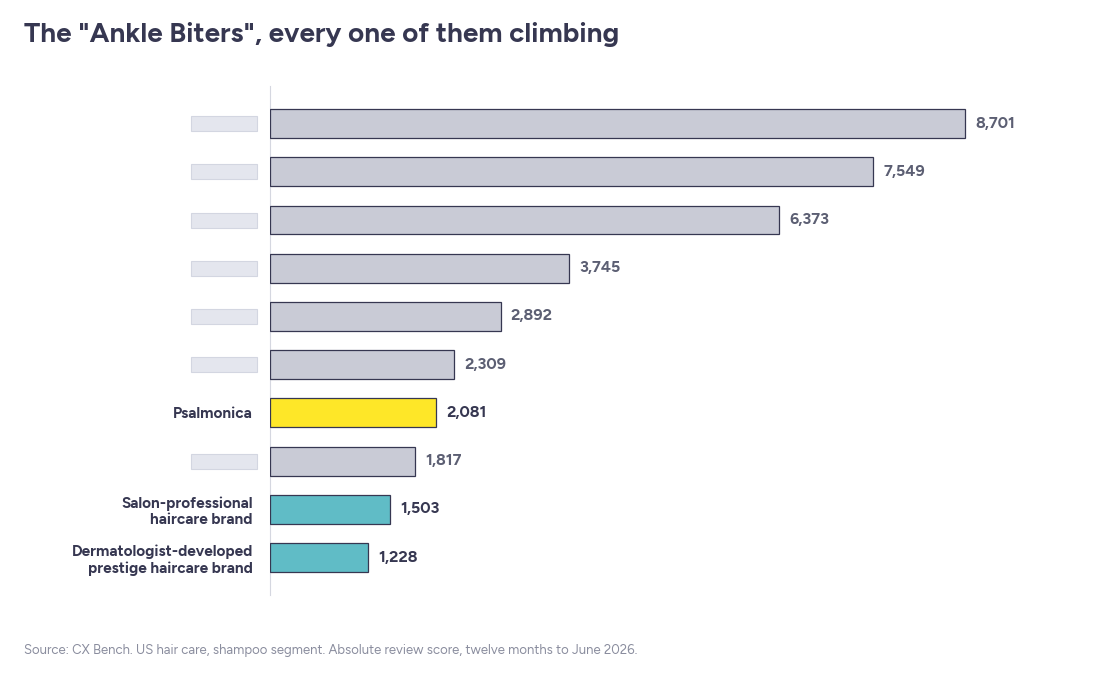
The volume band is deliberate. Below 100 reviews, a handful of enthusiastic shoppers can carry a score. Above 2,000, review programmes tend to be doing more of the work. The 100 to 2,000 range is where the agile competitors and fast-growing niche players sit, and they are less likely to show up in a CPG market research share report. It also means large, well-performing brands are excluded by design, which is the point rather than an oversight.
Nine of the ten brands are hidden. If you would like to know whether yours is one, just ask.
A closer look at one of the ten, Psalmonica

Psalmonica, highlighted in yellow on the chart, is a fast-growing hair growth brand, with an average review rating of 4.75 (the shampoo category average review score is 4.23). Total review volume grew 280%, from 202 to 768. On the headline numbers, it is one of the standout performers in US shampoo.
The review text adds useful texture and shows why a rating alone only takes you so far.
Consumers are discussing a slightly different product to the one on the shelf
Psalmonica is positioned as a shampoo, but shoppers largely talk about it as a serum: 208 reviews mention the serum format, 27.1%, and 243 mention hair growth, 31.6%. Scent and fragrance leads at 284 reviews, 37%, ahead of hair healing and damage repair at 22.7%. Those are genuine assets, and they suggest the strongest marketing opportunity sits with hair growth rather than cleansing.
A few themes point to clear product opportunities
Hair loss features in 87 reviews, 11.3%, oily or greasy hair in 71, 9.2%, and unwanted residue in 48, 6.3%, which matters more for a leave-on. A smaller group, 28 reviews or 3.7%, raise questions about product authenticity. Reviews often surface that kind of pattern early, before it shows up anywhere else.
Recent months are worth watching
Monthly volume peaked at 203 reviews in September 2025 at an average rating of 4.9, with a high of 4.93 in October. June 2026 came in at 3.62, though on only 13 reviews, so a small base and a single month rather than a trend.
One more thing. Alongside a review rating of 4.75 across all reviews, Psalmonica’s average product rating sits at 4.25, measuring performance at individual listing level. That variance between listings and overall sentiment is often where the practical fixes live.
Taken together, it looks like Psalmonica is growing quickly and learning as it goes, which is the difference between tracking and anticipating.
What Psalmonica shows that is worth borrowing
Three things stand out here, each worth testing against your own reviews. Fragrance is the most discussed topic, ahead of any single performance theme. The strongest themes sit in a benefit and format that are not shampoo, so a rival can take review share without competing with you directly. And the two clearest problems, authenticity (counterfeits) and residue, belong to product rather than marketing.
What this means if you are an established brand

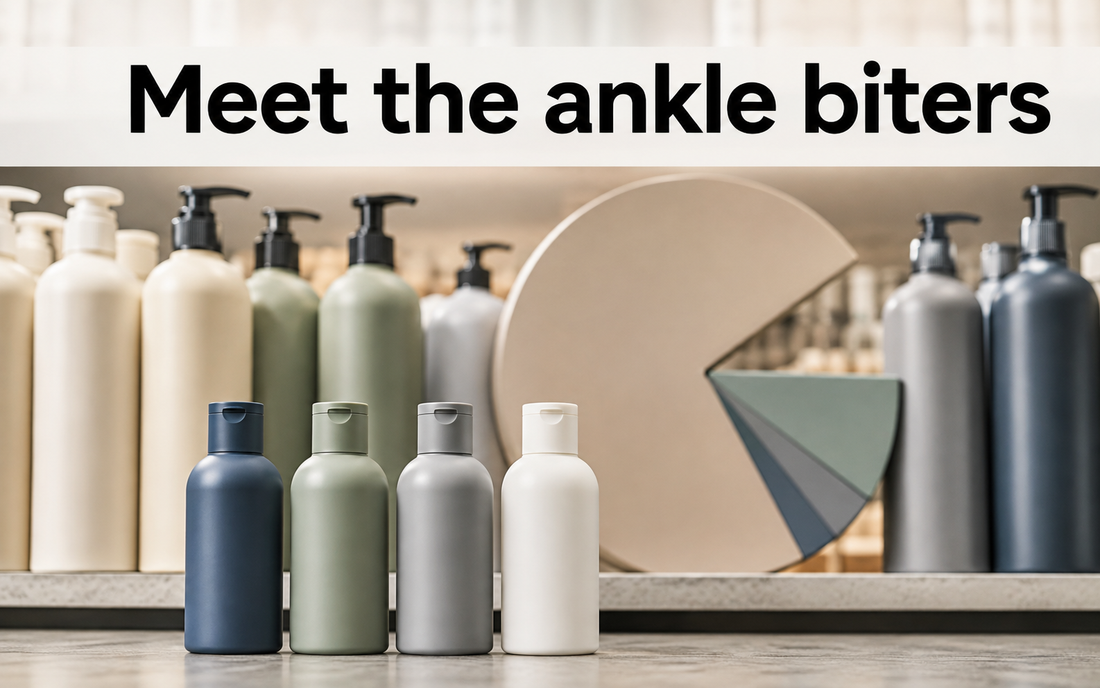
The Ankle Biters offer an early read on where expectations are heading. Four questions worth asking if you are in consumer insights:
-
- Which brands are growing in terms of Reviews score? What about my brands’ trajectory?
-
- What is driving growth/decline in reviews scores? How can I use that to tweak my communication, product improvements?
-
- What makes these ankle biters successful? Ingredient story? Benefits offered?
-
- What does your review rating look like once promoted and syndicated reviews are excluded, and how far is that from the number you usually report?
Ask it in plain English
Every one of those questions can be typed straight into Presto, in ordinary language. No dashboard training, no query builder, no waiting on an analyst to build you a view. Ask which challengers in your category are clearing 4.5, or what shoppers actually say about your scent, and it answers from the same data behind this article, in the time it takes to type the question. All of it, year long and for a fraction of what a single commissioned study costs.
The brands paying attention to their challengers today tend to be the ones setting the agenda tomorrow.
Curious what your category’s Ankle Biters are telling you? That is what CX Bench is for. Book a demo.
Brand data: CX Bench, US hair care, shampoo segment, non-promoted reviews unless stated, twelve months to June 2026.